You’ve written a how-to blog post filled with great tips. Now, make it more actionable: Turn your blog post into an infographic.
All you need to do are two things:
- Edit your blog post into its main ideas/steps.
- Use an infographic design template from Canva.
Canva is a free, graphic design tool for nondesigners. I’ll show you how to create your own infographic below.
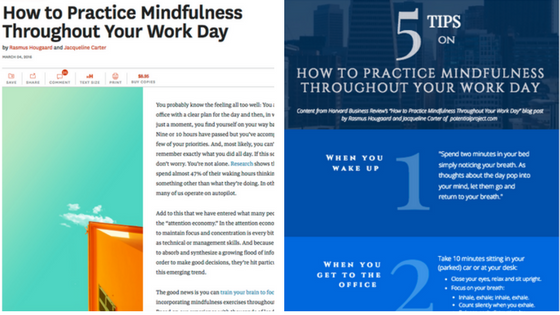
Example of a how-to infographic
But first, you’ll see a sample infographic I created from a March 4, 2016, blog post published on the Harvard Business Review website.
When I read that post, “How to Practice Mindfulness Throughout Your Work Day,” I was immediately inspired by the steps it described. But I knew I’d never take those steps unless I had a cheat sheet.
That inspired me to turn the post into an infographic using a Canva infographic template.
After I finished the infographic, I emailed the writers (Rasmus Hougaard and Jacqueline Carter) and asked for permission to publish it. They approved, and here we are.
Blog post turned into an infographic.

Infographic: Steps for turning a blog post into an infographics
Now, here’s a step-by-step guide on how you can turn one of your own how-to blog posts into an infographic.

Were these infographics helpful? Let me know in the comments.
More Blog Editing Tips
If you’d like to learn more about repurposing blog content or improving your writing quality and search engine optimization, sign up for My Blog Editor blog post alerts.

This was so helpful! I keep wondering how to do this and didn’t know Canva offered this. Thank you so much for sharing such useful info with all of us. I appreciate your generosity.
Awesome, Kathy. I’m glad it was helpful. Canva makes it so easy to break down blog posts (or any content, really) into helpful tips, ideas or information. I ❤️ Canva. Let me know if you have any questions!